Part 7: Observability: logs, metrics, traces and health checks
When something is slow or failing in production, how will you find out, and how will you find out why?
Series: Build a production-grade REST API in Go · Part 7 of 17 Where we are: the PostgreSQL API from Part 6.
This post is all Go code and runs locally; the only thing you need is the Postgres from Part 6. In Part 8 we package everything in containers and add the tools that display this data (Prometheus, Grafana, Jaeger).
Right now our server is a black box. If users say "the site is slow", we have no idea which endpoint, how slow, or whether it's the database. Observability is the ability to answer such questions about a running system without shipping new code. It rests on three kinds of data, called the three pillars:
| Pillar | Question it answers | Nature | Tool in this series |
|---|---|---|---|
| Metrics | Is something wrong? How bad? Since when? | cheap aggregated numbers over time | Prometheus |
| Traces | Where did this slow request spend its time? | the tree of work for one request | OpenTelemetry → Jaeger |
| Logs | What exactly happened in this one request? | discrete events with detail | slog JSON → Loki |
They're most powerful connected: an alert fires (metric), you open a slow request's trace, and jump from it to that request's logs. The glue is a shared identifier on every signal, which we build in this post.
Pillar 1: structured logs with correlation
We've used slog since Part 3. Now we make every log line carry the identifiers that tie it to a request and a trace.
A request id
internal/middleware/middleware.go (excerpt)
// RequestID gives every request a correlation id: it reuses the caller's
// X-Request-ID (so ids flow across services) or mints one, stores it in the
// context (the logger picks it up) and echoes it in the response header so a
// user reporting a problem can quote it.
func RequestID(next http.Handler) http.Handler {
	return http.HandlerFunc(func(w http.ResponseWriter, r *http.Request) {
		id := r.Header.Get("X-Request-ID")
		// Never trust client input blindly: cap length so it can't bloat logs.
		if id == "" || len(id) > 64 {
			b := make([]byte, 8)
			_, _ = rand.Read(b)
			id = hex.EncodeToString(b)
		}
		w.Header().Set("X-Request-ID", id)
		next.ServeHTTP(w, r.WithContext(observability.WithRequestID(r.Context(), id)))
	})
}
Every request gets an id (or reuses the caller's X-Request-ID, so ids flow across services). It goes into the request context, and is echoed in the response header so a user reporting a problem can quote it. Note the length cap: never trust client input blindly, not even for a header that ends up in your logs.
A logger that adds the ids automatically
internal/observability/logging.go (excerpt)
// contextHandler decorates any slog.Handler: on every log call made with a
// context (logger.InfoContext(ctx, ...)) it appends request_id, trace_id and
// span_id taken from that context. Application code never has to remember to
// add them, and every log line becomes joinable with its trace in Grafana.
type contextHandler struct{ slog.Handler }

// NewLogger returns a JSON logger (machine-parseable, what Loki/ELK expect).
func NewLogger(w io.Writer, level slog.Level, service string) *slog.Logger {
	h := slog.NewJSONHandler(w, &slog.HandlerOptions{Level: level})
	return slog.New(contextHandler{h}).With("service", service)
}
slog.Handler is an interface, so we can decorate one. contextHandler wraps the standard JSON handler: whenever code logs with a context (log.InfoContext(ctx, ...)), it appends request_id, trace_id and span_id taken from that context. Application code never has to remember to add them. (This is why handlers use the *Context logging methods: a log call made without the request's context loses the link.)
A real log line from this point in the series:
{"time":"2026-10-18T12:28:04.417082+05:30","level":"INFO","msg":"request","service":"rest-go",
 "method":"GET","route":"GET /users/{id}","path":"/users/1","status":200,
 "duration_ms":0.898,"remote":"[::1]:64015","request_id":"demo-123"}
Note both route (GET /users/{id}, the pattern) and path (/users/1, the actual URL). We'll see why that distinction matters in a moment.
Logging rules of thumb: one line per request at INFO; client mistakes (4xx) are INFO because they aren't our fault; only 5xx are ERROR (otherwise alerts drown in noise); never log passwords, tokens, full request bodies or connection strings.
Pillar 2: metrics
What to measure: the RED method
For any request-driven service, three numbers tell you if it's healthy:
- Rate: requests per second
- Errors: how many fail
- Duration: how long they take
internal/observability/metrics.go (excerpt)
// Metrics owns a private registry (not the global default) so tests can build
// many without "duplicate registration" panics.
type Metrics struct {
	Registry *prometheus.Registry

	requests *prometheus.CounterVec
	duration *prometheus.HistogramVec
	inFlight prometheus.Gauge
}

func NewMetrics(pool *pgxpool.Pool) *Metrics {
	m := &Metrics{
		Registry: prometheus.NewRegistry(),
		// RED method: Rate, Errors, Duration. These three answer "is the
		// service healthy?" for any request-driven system.
		requests: prometheus.NewCounterVec(prometheus.CounterOpts{
			Name: "http_requests_total",
			Help: "Completed HTTP requests.",
		}, []string{"method", "route", "status"}),
		duration: prometheus.NewHistogramVec(prometheus.HistogramOpts{
			Name:    "http_request_duration_seconds",
			Help:    "HTTP request latency.",
			Buckets: []float64{.005, .01, .025, .05, .1, .25, .5, 1, 2.5, 5, 10},
		}, []string{"method", "route"}),
		inFlight: prometheus.NewGauge(prometheus.GaugeOpts{
			Name: "http_requests_in_flight",
			Help: "Requests currently being served.",
		}),
	}
	m.Registry.MustRegister(
		m.requests, m.duration, m.inFlight,
		collectors.NewGoCollector(),                                       // goroutines, GC, heap
		collectors.NewProcessCollector(collectors.ProcessCollectorOpts{}), // fds, cpu, rss
	)
	if pool != nil {
		m.Registry.MustRegister(newPoolCollector(pool))
	}
	return m
}
http_requests_total{method,route,status}is a counter: it only goes up. Rate = how fast it increases; errors = the same counter filtered tostatus=~"5..".http_request_duration_secondsis a histogram: it counts how many requests fell into each latency bucket. Why not just record the average? Because averages hide pain: 99 requests at 10 ms and one at 10 s average to ~110 ms, which looks fine while one user waits ten seconds. Histograms let Prometheus compute percentiles (p95, p99), which is how you reason about latency.http_requests_in_flightis a gauge: a value that goes up and down.- We also register Go runtime metrics (goroutines, GC, heap) and process metrics for free.
- We create our own registry instead of using Prometheus's global default, so tests can build many without "duplicate registration" panics.
The middleware, and the cardinality trap
internal/observability/metrics.go (excerpt)
// Middleware records RED metrics. The `route` label is the registered PATTERN
// ("GET /users/{id}"), never the raw path ("/users/42"): raw paths would mint a
// new time series per id (a "cardinality explosion") and could crash Prometheus.
//
// IMPORTANT ordering rule: r.Pattern is filled in by the ServeMux on the exact
// *http.Request it receives. This middleware must therefore sit where it hands
// that same request to the mux unchanged: after any middleware that copies the
// request (r.WithContext). See cmd/rest/main.go for the chain.
func (m *Metrics) Middleware(next http.Handler) http.Handler {
	return http.HandlerFunc(func(w http.ResponseWriter, r *http.Request) {
		m.inFlight.Inc()
		defer m.inFlight.Dec()

		start := time.Now()
		rec := NewStatusRecorder(w)
		next.ServeHTTP(rec, r)

		route := r.Pattern
		if route == "" {
			route = "unmatched" // 404s for unknown paths share one label
		}
		m.requests.WithLabelValues(r.Method, route, strconv.Itoa(rec.Status)).Inc()
		m.duration.WithLabelValues(r.Method, route).Observe(time.Since(start).Seconds())
	})
}
Look at the route label. We use r.Pattern (GET /users/{id}), not r.URL.Path (/users/42). This is the single most important metrics decision in the post:
Every distinct combination of label values is a separate time series that Prometheus stores forever. If you label by the raw path, every user id creates a new series. A scanner hitting
/users/1,/users/2,/users/3... can create millions and take your monitoring down. This is called a cardinality explosion.
Rule: labels must come from a small, fixed set (methods, route patterns, status codes). Never label with user ids, emails, request ids or raw URLs. Unknown paths fall into a single route="unmatched" series.
Here's what the endpoint serves (formatted for reading):
http_requests_total{method="GET", route="GET /users/{id}", status="200"} 2
http_requests_total{method="GET", route="GET /users/{id}", status="404"} 1
http_requests_total{method="POST",route="POST /users",     status="201"} 3
http_requests_total{method="POST",route="POST /users",     status="422"} 1
db_pool_max_conns 10
db_pool_idle_conns 3
Watching the database pool
Remember our discussion of MaxConns in Part 6? A custom collector exports the pool's statistics at scrape time:
internal/observability/metrics.go (excerpt)
// poolCollector exposes pgxpool.Stat() as Prometheus metrics. A custom
// Collector reads the stats at scrape time, so values are always current and
// there is no background goroutine.
type poolCollector struct {
	pool                                          *pgxpool.Pool
	acquired, idle, total, max, acquires, emptyAc *prometheus.Desc
	waitSeconds                                   *prometheus.Desc
}

func newPoolCollector(pool *pgxpool.Pool) *poolCollector {
	d := func(name, help string) *prometheus.Desc {
		return prometheus.NewDesc("db_pool_"+name, help, nil, nil)
	}
	return &poolCollector{
		pool:        pool,
		acquired:    d("acquired_conns", "Connections currently in use."),
		idle:        d("idle_conns", "Idle connections."),
		total:       d("total_conns", "Open connections."),
		max:         d("max_conns", "Configured pool maximum."),
		acquires:    d("acquire_total", "Total successful connection acquisitions."),
		emptyAc:     d("empty_acquire_total", "Acquisitions that had to WAIT because the pool was exhausted."),
		waitSeconds: d("acquire_wait_seconds_total", "Total time spent waiting for a connection."),
	}
}

func (c *poolCollector) Collect(ch chan<- prometheus.Metric) {
	s := c.pool.Stat()
	g, ctr := prometheus.GaugeValue, prometheus.CounterValue
	ch <- prometheus.MustNewConstMetric(c.acquired, g, float64(s.AcquiredConns()))
	ch <- prometheus.MustNewConstMetric(c.idle, g, float64(s.IdleConns()))
	ch <- prometheus.MustNewConstMetric(c.total, g, float64(s.TotalConns()))
	ch <- prometheus.MustNewConstMetric(c.max, g, float64(s.MaxConns()))
	ch <- prometheus.MustNewConstMetric(c.acquires, ctr, float64(s.AcquireCount()))
	ch <- prometheus.MustNewConstMetric(c.emptyAc, ctr, float64(s.EmptyAcquireCount()))
	ch <- prometheus.MustNewConstMetric(c.waitSeconds, ctr, s.AcquireDuration().Seconds())
}
The key metric is db_pool_empty_acquire_total: how many times a request had to wait because every connection was busy. If it rises, your pool is exhausted: either queries are slow or MaxConns is too low. Without this number you would only see "the API got slow" and guess.
An ordering gotcha
ServeMux writes the matched pattern onto the request object it receives. Middleware that calls r.WithContext(...) makes a copy, so the pattern lands on the copy, not on the request your outer middleware holds. That's why the chain in main is ordered deliberately:
Handler: middleware.Chain(mux,
    otelhttp wrapper,          // copies the request
    middleware.RequestID,      // copies
    middleware.Timeout(...),   // copies
    middleware.TraceRoute,     // reads r.Pattern: must come AFTER every copier
    middleware.Logging(log),   //   "
    metrics.Middleware,        //   "
    middleware.Recover(log),   // innermost: a panic becomes a 500 that Logging and Metrics still record
),
Get this order wrong and every route label silently becomes unmatched. A unit test (TestMetricsUseRoutePatternNotPath) guards it.
Pillar 3: distributed tracing
A trace is the tree of work done for one request; each node is a span (name, start, duration). Imagine POST /orders in a trace viewer:
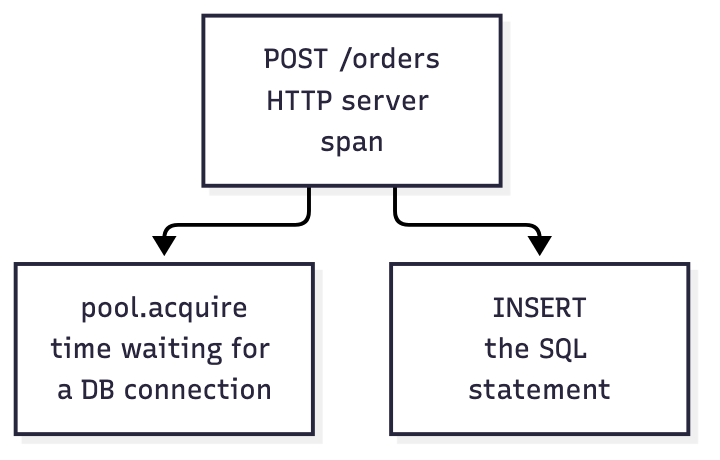
If this request took 800 ms, the trace shows immediately whether the time went into waiting for a connection, running the INSERT, or somewhere else.
We use OpenTelemetry (OTel), the vendor-neutral standard, and export spans over OTLP:
internal/observability/tracing.go (excerpt)
// InitTracing installs a global OpenTelemetry tracer provider that exports
// spans over OTLP/gRPC (to Jaeger, Tempo, an OTel Collector, ...). With an
// empty endpoint tracing stays a no-op: spans are free and nothing is sent.
// The returned function flushes buffered spans; call it on shutdown.
func InitTracing(ctx context.Context, service, endpoint string, sampleRatio float64) (func(context.Context) error, error) {
	// Propagation is what stitches traces ACROSS services: it reads/writes the
	// W3C `traceparent` header so a caller's trace continues in this service.
	otel.SetTextMapPropagator(propagation.NewCompositeTextMapPropagator(
		propagation.TraceContext{}, propagation.Baggage{}))

	if endpoint == "" {
		return func(context.Context) error { return nil }, nil
	}

	exp, err := otlptracegrpc.New(ctx,
		otlptracegrpc.WithEndpoint(endpoint),
		otlptracegrpc.WithInsecure()) // plaintext inside the private network
	if err != nil {
		return nil, fmt.Errorf("create otlp exporter: %w", err)
	}

	res, err := resource.New(ctx, resource.WithAttributes(attribute.String("service.name", service)))
	if err != nil {
		return nil, fmt.Errorf("create resource: %w", err)
	}

	tp := sdktrace.NewTracerProvider(
		sdktrace.WithBatcher(exp), // buffer + send in batches, off the request path
		sdktrace.WithResource(res),
		// ParentBased: if an upstream service already decided to sample this
		// trace, follow it; otherwise sample sampleRatio of new traces.
		sdktrace.WithSampler(sdktrace.ParentBased(sdktrace.TraceIDRatioBased(sampleRatio))),
	)
	otel.SetTracerProvider(tp)
	return tp.Shutdown, nil
}
Concepts inside:
- Propagation: the
traceparentHTTP header (W3C standard) carries the trace id between services. If a caller already started a trace, ours continues it instead of starting a new one. - Sampling: recording 100% of traces is fine on a laptop and costly at scale.
ParentBased(TraceIDRatioBased(r))samples a fraction of new traces and follows any upstream decision. - Batching: spans are exported in the background; tracing never blocks a request.
- Off by default: with no
OTLP_ENDPOINT, tracing is a no-op.
Two integrations do the heavy lifting: otelhttp wraps our server (creates the root span per request), and otelpgx is attached to the pgx pool config in storage.NewPool, so each query becomes a child span. They connect because we always pass r.Context() down to the store; the span lives in the context. This is a second reason, besides cancellation, that every function takes a ctx.
A small touch, TraceRoute, renames the span after routing, because otelhttp has to start it before the router has picked a route:
internal/middleware/middleware.go (excerpt)
// TraceRoute renames the server span after routing, e.g. "GET /users/{id}".
// otelhttp starts the span BEFORE the mux has picked a route, so it can only
// name it "GET"; here (after next) r.Pattern is known. Like Metrics/Logging it
// must receive the same request object the mux gets (see main.go ordering).
func TraceRoute(next http.Handler) http.Handler {
	return http.HandlerFunc(func(w http.ResponseWriter, r *http.Request) {
		next.ServeHTTP(w, r)
		if r.Pattern != "" {
			span := trace.SpanFromContext(r.Context())
			span.SetName(r.Pattern)
			span.SetAttributes(attribute.String("http.route", r.Pattern))
		}
	})
}
(Without a trace backend running, trace_id stays absent from log lines. In Part 8 we start Jaeger, and then every log line carries it.)
Health checks: liveness vs readiness
Orchestrators (Kubernetes, Docker, load balancers) need to ask "are you OK?". There are two distinct questions:
internal/observability/health.go (excerpt)
// Health serves the two Kubernetes-style probes:
//
//   - /healthz (liveness):  "is the process alive?" Never checks dependencies:
//     if the DB is down, restarting THIS process won't fix it, and restart
//     loops would make an outage worse.
//   - /readyz (readiness): "should I receive traffic right now?" Checks the DB
//     and fails during shutdown so load balancers drain us gracefully.
type Health struct {
	db       Pinger
	shutting atomic.Bool
}

func (h *Health) Live(w http.ResponseWriter, _ *http.Request) {
	w.WriteHeader(http.StatusOK)
	_, _ = w.Write([]byte("ok\n"))
}

func (h *Health) Ready(w http.ResponseWriter, r *http.Request) {
	if h.shutting.Load() {
		http.Error(w, "shutting down", http.StatusServiceUnavailable)
		return
	}
	// Short deadline: a hung database must make the probe FAIL fast, not hang.
	ctx, cancel := context.WithTimeout(r.Context(), 2*time.Second)
	defer cancel()
	if err := h.db.Ping(ctx); err != nil {
		http.Error(w, "database unavailable", http.StatusServiceUnavailable)
		return
	}
	_, _ = w.Write([]byte("ready\n"))
}
| Probe | Question | Checks DB? | If it fails |
|---|---|---|---|
/healthz (liveness) |
Is the process alive? | No | orchestrator restarts it |
/readyz (readiness) |
Should I send it traffic now? | Yes (2 s timeout) | orchestrator stops routing to it |
Why liveness must not check the database: if the DB goes down, restarting your healthy API processes fixes nothing and creates a restart storm that makes the outage worse. Readiness should check it: take the instance out of rotation until the dependency recovers. It also fails during shutdown so load balancers drain traffic first.
A separate admin port
Metrics and health endpoints are for machines, not the public. In main they live on a second server (ADMIN_ADDR, default :9090):
adminMux.Handle("GET /metrics", metrics.Handler())
adminMux.HandleFunc("GET /healthz", health.Live)
adminMux.HandleFunc("GET /readyz", health.Ready)
so you can expose :7800 to the internet and keep :9090 inside your private network. Metrics can reveal internals (route names, error rates) that you don't want to hand to everyone.
cmd/rest/main.go (excerpt)
func serve() error {
	cfg, err := config.Load()
	if err != nil {
		return err
	}
	log := observability.NewLogger(os.Stdout, cfg.LogLevel, cfg.ServiceName)
	slog.SetDefault(log)

	// ctx is cancelled on Ctrl-C (SIGINT) or SIGTERM (what Docker/Kubernetes
	// send on stop), which triggers graceful shutdown below.
	ctx, stop := signal.NotifyContext(context.Background(), os.Interrupt, syscall.SIGTERM)
	defer stop()

	shutdownTracing, err := observability.InitTracing(ctx, cfg.ServiceName, cfg.OTLPEndpoint, cfg.TraceSampleRatio)
	if err != nil {
		return err
	}

	pool, err := storage.NewPool(ctx, poolConfig(cfg))
	if err != nil {
		return err
	}
	defer pool.Close() // runs last (defers are LIFO), after the servers stop

	metrics := observability.NewMetrics(pool)
	health := observability.NewHealth(pool)

	limits := handlers.Limits{MaxBodyBytes: cfg.MaxBodyBytes, MaxNameLen: cfg.MaxNameLen}
	users := handlers.NewUserHandler(storage.NewUserStore(pool), log, limits)
	orders := handlers.NewOrderHandler(storage.NewOrderStore(pool), log, limits)
	mux := http.NewServeMux()
	routes.SetupRoutes(mux, users, orders)

	// First listed = outermost. ORDER MATTERS:
	//  1. otelhttp, RequestID, Timeout all COPY the request (r.WithContext), so
	//     they go first.
	//  2. Logging and Metrics read r.Pattern after the mux has routed. The mux
	//     sets it on the exact request object it receives, so these must pass
	//     the request through unchanged: they come after every copier.
	//  3. Recover is innermost so a panic becomes a 500 that Logging/Metrics
	//     still record.
	api := &http.Server{
		Addr: cfg.Addr,
		Handler: middleware.Chain(mux,
			func(next http.Handler) http.Handler { return otelhttp.NewHandler(next, "http.server") },
			middleware.RequestID,
			middleware.Timeout(cfg.RequestTimeout),
			middleware.TraceRoute,
			middleware.Logging(log),
			metrics.Middleware,
			middleware.Recover(log),
		),
		// The zero-value http.Server has NO timeouts, so slow or malicious
		// clients (e.g. Slowloris) can hold connections open forever.
		ReadHeaderTimeout: cfg.ReadHeaderTimeout,
		ReadTimeout:       cfg.ReadTimeout,
		WriteTimeout:      cfg.WriteTimeout,
		IdleTimeout:       cfg.IdleTimeout,
	}

	// Operational endpoints live on a SEPARATE port: metrics and health are for
	// Prometheus/orchestrators, and must never be exposed through the public
	// listener / ingress.
	adminMux := http.NewServeMux()
	adminMux.Handle("GET /metrics", metrics.Handler())
	adminMux.HandleFunc("GET /healthz", health.Live)
	adminMux.HandleFunc("GET /readyz", health.Ready)
	admin := &http.Server{Addr: cfg.AdminAddr, Handler: adminMux, ReadHeaderTimeout: 5 * time.Second}

	errc := make(chan error, 2)
	for name, srv := range map[string]*http.Server{"api": api, "admin": admin} {
		go func() {
			log.Info("listening", "server", name, "addr", srv.Addr)
			errc <- srv.ListenAndServe()
		}()
	}

	select {
	case err := <-errc:
		// ErrServerClosed is the normal result of Shutdown, not a failure.
		if !errors.Is(err, http.ErrServerClosed) {
			return err
		}
	case <-ctx.Done():
		log.Info("shutdown signal received")
	}

	// Graceful shutdown sequence:
	//  1. fail /readyz so the load balancer stops routing new traffic here,
	//  2. optionally wait ShutdownDelay so it notices,
	//  3. stop accepting connections and let in-flight requests finish,
	//  4. flush buffered traces, then (deferred) close the DB pool.
	health.SetShuttingDown()
	time.Sleep(cfg.ShutdownDelay)

	sctx, cancel := context.WithTimeout(context.Background(), cfg.ShutdownTimeout)
	defer cancel()
	var errs []error
	errs = append(errs, api.Shutdown(sctx), admin.Shutdown(sctx), shutdownTracing(sctx))
	if err := errors.Join(errs...); err != nil {
		return err
	}
	log.Info("server stopped cleanly")
	return nil
}
(main.go also gained two small subcommands you'll see in the listing below: migrate, used from now on to apply the schema, and healthcheck, which Part 8's container will call.)
Read the end of serve(): the graceful shutdown sequence is now (1) fail /readyz, (2) optionally wait SHUTDOWN_DELAY so the load balancer notices, (3) shut both servers down, (4) flush buffered traces, and then the deferred pool close runs last.
Complete code for this part
Everything to type, file by file. Then go mod tidy (it pulls in the OpenTelemetry, Prometheus and pgx tracing libraries) and go build ./....
Replace the contents of internal/config/config.go with
// Package config loads all tunables in one place, from environment variables
// (twelve-factor style). main wires values into components explicitly; no
// component reads os.Getenv or hides a magic number.
package config

import (
	"fmt"
	"log/slog"
	"os"
	"strconv"
	"time"
)

type Config struct {
	Addr      string // public API listener
	AdminAddr string // metrics + health; keep OFF the public internet

	DatabaseURL   string
	DBMaxConns    int32
	DBMinConns    int32
	DBMaxConnLife time.Duration
	DBMaxConnIdle time.Duration

	// http.Server timeouts: enforced by net/http, below the handler layer.
	ReadHeaderTimeout time.Duration
	ReadTimeout       time.Duration
	WriteTimeout      time.Duration
	IdleTimeout       time.Duration
	ShutdownTimeout   time.Duration
	// ShutdownDelay: after the readiness probe starts failing, keep serving this
	// long so the load balancer notices and stops sending traffic first.
	ShutdownDelay time.Duration

	// RequestTimeout is the per-request context deadline. Must be below
	// WriteTimeout so we can still send a reply.
	RequestTimeout time.Duration

	MaxBodyBytes int64
	MaxNameLen   int

	ServiceName      string
	LogLevel         slog.Level
	OTLPEndpoint     string // host:port of an OTLP/gRPC collector; empty disables tracing
	TraceSampleRatio float64
}

func Load() (Config, error) {
	c := Config{
		Addr:              env("ADDR", ":7800"),
		AdminAddr:         env("ADMIN_ADDR", ":9090"),
		DatabaseURL:       os.Getenv("DATABASE_URL"),
		DBMaxConns:        10,
		DBMinConns:        2,
		DBMaxConnLife:     30 * time.Minute,
		DBMaxConnIdle:     5 * time.Minute,
		ReadHeaderTimeout: 5 * time.Second,
		ReadTimeout:       10 * time.Second,
		WriteTimeout:      15 * time.Second,
		IdleTimeout:       60 * time.Second,
		ShutdownTimeout:   15 * time.Second,
		RequestTimeout:    10 * time.Second,
		MaxBodyBytes:      1 << 20,
		MaxNameLen:        100,
		ServiceName:       env("SERVICE_NAME", "rest-go"),
		OTLPEndpoint:      os.Getenv("OTLP_ENDPOINT"),
		TraceSampleRatio:  1.0,
	}

	var err error
	durations := []struct {
		key string
		dst *time.Duration
	}{
		{"DB_MAX_CONN_LIFETIME", &c.DBMaxConnLife},
		{"DB_MAX_CONN_IDLE_TIME", &c.DBMaxConnIdle},
		{"READ_HEADER_TIMEOUT", &c.ReadHeaderTimeout},
		{"READ_TIMEOUT", &c.ReadTimeout},
		{"WRITE_TIMEOUT", &c.WriteTimeout},
		{"IDLE_TIMEOUT", &c.IdleTimeout},
		{"SHUTDOWN_TIMEOUT", &c.ShutdownTimeout},
		{"SHUTDOWN_DELAY", &c.ShutdownDelay},
		{"REQUEST_TIMEOUT", &c.RequestTimeout},
	}
	for _, d := range durations {
		if v := os.Getenv(d.key); v != "" {
			if *d.dst, err = time.ParseDuration(v); err != nil {
				return c, fmt.Errorf("%s: %w", d.key, err)
			}
		}
	}
	for _, i := range []struct {
		key string
		dst *int32
	}{{"DB_MAX_CONNS", &c.DBMaxConns}, {"DB_MIN_CONNS", &c.DBMinConns}} {
		if v := os.Getenv(i.key); v != "" {
			n, err := strconv.ParseInt(v, 10, 32)
			if err != nil {
				return c, fmt.Errorf("%s: %w", i.key, err)
			}
			*i.dst = int32(n)
		}
	}
	if v := os.Getenv("MAX_BODY_BYTES"); v != "" {
		if c.MaxBodyBytes, err = strconv.ParseInt(v, 10, 64); err != nil {
			return c, fmt.Errorf("MAX_BODY_BYTES: %w", err)
		}
	}
	if v := os.Getenv("MAX_NAME_LEN"); v != "" {
		if c.MaxNameLen, err = strconv.Atoi(v); err != nil {
			return c, fmt.Errorf("MAX_NAME_LEN: %w", err)
		}
	}
	if v := os.Getenv("TRACE_SAMPLE_RATIO"); v != "" {
		if c.TraceSampleRatio, err = strconv.ParseFloat(v, 64); err != nil {
			return c, fmt.Errorf("TRACE_SAMPLE_RATIO: %w", err)
		}
	}
	if v := os.Getenv("LOG_LEVEL"); v != "" {
		if err = c.LogLevel.UnmarshalText([]byte(v)); err != nil {
			return c, fmt.Errorf("LOG_LEVEL: %w", err)
		}
	}

	// Fail fast on missing or nonsense values instead of misbehaving at runtime.
	switch {
	case c.DatabaseURL == "":
		return c, fmt.Errorf("DATABASE_URL is required")
	case c.MaxBodyBytes <= 0 || c.MaxNameLen <= 0 || c.RequestTimeout <= 0:
		return c, fmt.Errorf("limits and request timeout must be positive")
	case c.RequestTimeout >= c.WriteTimeout:
		return c, fmt.Errorf("REQUEST_TIMEOUT (%s) must be below WRITE_TIMEOUT (%s)", c.RequestTimeout, c.WriteTimeout)
	case c.DBMaxConns < 1 || c.DBMinConns < 0 || c.DBMinConns > c.DBMaxConns:
		return c, fmt.Errorf("need 0 <= DB_MIN_CONNS <= DB_MAX_CONNS and DB_MAX_CONNS >= 1")
	case c.TraceSampleRatio < 0 || c.TraceSampleRatio > 1:
		return c, fmt.Errorf("TRACE_SAMPLE_RATIO must be within [0,1]")
	}
	return c, nil
}

func env(key, fallback string) string {
	if v := os.Getenv(key); v != "" {
		return v
	}
	return fallback
}
Change internal/handlers/base.go
--- a/internal/handlers/base.go
+++ b/internal/handlers/base.go
@@ -84,10 +84,10 @@ func (b base) storeError(w http.ResponseWriter, r *http.Request, op string, err
 func (b base) internalError(w http.ResponseWriter, r *http.Request, op string, err error) {
 	// A cancelled request context is the client leaving, not a server fault.
 	if errors.Is(err, context.Canceled) {
-		b.log.Info("request cancelled", "op", op, "method", r.Method, "path", r.URL.Path)
+		b.log.InfoContext(r.Context(), "request cancelled", "op", op, "method", r.Method, "path", r.URL.Path)
 		return
 	}
-	b.log.Error("handler failed", "op", op, "method", r.Method, "path", r.URL.Path, "err", err)
+	b.log.ErrorContext(r.Context(), "handler failed", "op", op, "method", r.Method, "path", r.URL.Path, "err", err)
 	b.writeError(w, r, http.StatusInternalServerError, "internal server error")
 }

@@ -101,6 +101,6 @@ func (b base) writeJSON(w http.ResponseWriter, r *http.Request, status int, v an
 	w.Header().Set("Content-Type", "application/json")
 	w.WriteHeader(status)
 	if err := json.NewEncoder(w).Encode(v); err != nil {
-		b.log.Error("encode response", "path", r.URL.Path, "err", err)
+		b.log.ErrorContext(r.Context(), "encode response", "path", r.URL.Path, "err", err)
 	}
 }
Replace the contents of internal/middleware/middleware.go with
// Package middleware holds cross-cutting HTTP concerns. A middleware is just
// func(http.Handler) http.Handler: it wraps the next handler, running code
// before and/or after it.
package middleware

import (
	"context"
	"crypto/rand"
	"encoding/hex"
	"log/slog"
	"net/http"
	"time"

	"go.opentelemetry.io/otel/attribute"
	"go.opentelemetry.io/otel/trace"

	"go-rest/internal/observability"
)

// RequestID gives every request a correlation id: it reuses the caller's
// X-Request-ID (so ids flow across services) or mints one, stores it in the
// context (the logger picks it up) and echoes it in the response header so a
// user reporting a problem can quote it.
func RequestID(next http.Handler) http.Handler {
	return http.HandlerFunc(func(w http.ResponseWriter, r *http.Request) {
		id := r.Header.Get("X-Request-ID")
		// Never trust client input blindly: cap length so it can't bloat logs.
		if id == "" || len(id) > 64 {
			b := make([]byte, 8)
			_, _ = rand.Read(b)
			id = hex.EncodeToString(b)
		}
		w.Header().Set("X-Request-ID", id)
		next.ServeHTTP(w, r.WithContext(observability.WithRequestID(r.Context(), id)))
	})
}

// Timeout puts a deadline on each request's context. Handlers pass r.Context()
// to the store, so a slow query is cancelled when the deadline hits instead of
// running on after the client has given up.
func Timeout(d time.Duration) func(http.Handler) http.Handler {
	return func(next http.Handler) http.Handler {
		return http.HandlerFunc(func(w http.ResponseWriter, r *http.Request) {
			ctx, cancel := context.WithTimeout(r.Context(), d)
			defer cancel()
			next.ServeHTTP(w, r.WithContext(ctx))
		})
	}
}

// TraceRoute renames the server span after routing, e.g. "GET /users/{id}".
// otelhttp starts the span BEFORE the mux has picked a route, so it can only
// name it "GET"; here (after next) r.Pattern is known. Like Metrics/Logging it
// must receive the same request object the mux gets (see main.go ordering).
func TraceRoute(next http.Handler) http.Handler {
	return http.HandlerFunc(func(w http.ResponseWriter, r *http.Request) {
		next.ServeHTTP(w, r)
		if r.Pattern != "" {
			span := trace.SpanFromContext(r.Context())
			span.SetName(r.Pattern)
			span.SetAttributes(attribute.String("http.route", r.Pattern))
		}
	})
}

// Logging emits one structured access-log line per request. Because it logs
// with r.Context(), request_id / trace_id are attached automatically.
func Logging(log *slog.Logger) func(http.Handler) http.Handler {
	return func(next http.Handler) http.Handler {
		return http.HandlerFunc(func(w http.ResponseWriter, r *http.Request) {
			start := time.Now()
			rec := observability.NewStatusRecorder(w)
			next.ServeHTTP(rec, r)
			route := r.Pattern
			if route == "" {
				route = "unmatched"
			}
			level := slog.LevelInfo
			if rec.Status >= 500 {
				level = slog.LevelError
			}
			log.Log(r.Context(), level, "request",
				"method", r.Method,
				"route", route,
				"path", r.URL.Path,
				"status", rec.Status,
				"duration_ms", float64(time.Since(start).Microseconds())/1000,
				"remote", r.RemoteAddr,
			)
		})
	}
}

// Recover turns a panic in any handler into a 500 instead of a dropped
// connection, and logs it with context.
func Recover(log *slog.Logger) func(http.Handler) http.Handler {
	return func(next http.Handler) http.Handler {
		return http.HandlerFunc(func(w http.ResponseWriter, r *http.Request) {
			defer func() {
				if rec := recover(); rec != nil {
					log.ErrorContext(r.Context(), "panic recovered", "panic", rec, "method", r.Method, "path", r.URL.Path)
					http.Error(w, `{"error":"internal server error"}`, http.StatusInternalServerError)
				}
			}()
			next.ServeHTTP(w, r)
		})
	}
}

// Chain applies middlewares so the first listed is the outermost.
func Chain(h http.Handler, mws ...func(http.Handler) http.Handler) http.Handler {
	for i := len(mws) - 1; i >= 0; i-- {
		h = mws[i](h)
	}
	return h
}
Create internal/observability/health.go
package observability

import (
	"context"
	"net/http"
	"sync/atomic"
	"time"
)

// Pinger is satisfied by *pgxpool.Pool.
type Pinger interface {
	Ping(ctx context.Context) error
}

// Health serves the two Kubernetes-style probes:
//
//   - /healthz (liveness):  "is the process alive?" Never checks dependencies:
//     if the DB is down, restarting THIS process won't fix it, and restart
//     loops would make an outage worse.
//   - /readyz (readiness): "should I receive traffic right now?" Checks the DB
//     and fails during shutdown so load balancers drain us gracefully.
type Health struct {
	db       Pinger
	shutting atomic.Bool
}

func NewHealth(db Pinger) *Health { return &Health{db: db} }

// SetShuttingDown flips readiness to failing. Call it first on SIGTERM.
func (h *Health) SetShuttingDown() { h.shutting.Store(true) }

func (h *Health) Live(w http.ResponseWriter, _ *http.Request) {
	w.WriteHeader(http.StatusOK)
	_, _ = w.Write([]byte("ok\n"))
}

func (h *Health) Ready(w http.ResponseWriter, r *http.Request) {
	if h.shutting.Load() {
		http.Error(w, "shutting down", http.StatusServiceUnavailable)
		return
	}
	// Short deadline: a hung database must make the probe FAIL fast, not hang.
	ctx, cancel := context.WithTimeout(r.Context(), 2*time.Second)
	defer cancel()
	if err := h.db.Ping(ctx); err != nil {
		http.Error(w, "database unavailable", http.StatusServiceUnavailable)
		return
	}
	_, _ = w.Write([]byte("ready\n"))
}
Create internal/observability/logging.go
// Package observability wires the three pillars: logs, metrics, traces.
package observability

import (
	"context"
	"io"
	"log/slog"

	"go.opentelemetry.io/otel/trace"
)

type ctxKey struct{}

// WithRequestID / RequestID carry the per-request correlation id in the context.
func WithRequestID(ctx context.Context, id string) context.Context {
	return context.WithValue(ctx, ctxKey{}, id)
}

func RequestID(ctx context.Context) string {
	id, _ := ctx.Value(ctxKey{}).(string)
	return id
}

// contextHandler decorates any slog.Handler: on every log call made with a
// context (logger.InfoContext(ctx, ...)) it appends request_id, trace_id and
// span_id taken from that context. Application code never has to remember to
// add them, and every log line becomes joinable with its trace in Grafana.
type contextHandler struct{ slog.Handler }

func (h contextHandler) Handle(ctx context.Context, r slog.Record) error {
	if id := RequestID(ctx); id != "" {
		r.AddAttrs(slog.String("request_id", id))
	}
	if sc := trace.SpanContextFromContext(ctx); sc.IsValid() {
		r.AddAttrs(slog.String("trace_id", sc.TraceID().String()), slog.String("span_id", sc.SpanID().String()))
	}
	return h.Handler.Handle(ctx, r)
}

// WithAttrs / WithGroup must re-wrap, or the decoration is lost on logger.With().
func (h contextHandler) WithAttrs(a []slog.Attr) slog.Handler {
	return contextHandler{h.Handler.WithAttrs(a)}
}
func (h contextHandler) WithGroup(n string) slog.Handler {
	return contextHandler{h.Handler.WithGroup(n)}
}

// NewLogger returns a JSON logger (machine-parseable, what Loki/ELK expect).
func NewLogger(w io.Writer, level slog.Level, service string) *slog.Logger {
	h := slog.NewJSONHandler(w, &slog.HandlerOptions{Level: level})
	return slog.New(contextHandler{h}).With("service", service)
}
Create internal/observability/metrics.go
package observability

import (
	"net/http"
	"strconv"
	"time"

	"github.com/jackc/pgx/v5/pgxpool"
	"github.com/prometheus/client_golang/prometheus"
	"github.com/prometheus/client_golang/prometheus/collectors"
	"github.com/prometheus/client_golang/prometheus/promhttp"
)

// Metrics owns a private registry (not the global default) so tests can build
// many without "duplicate registration" panics.
type Metrics struct {
	Registry *prometheus.Registry

	requests *prometheus.CounterVec
	duration *prometheus.HistogramVec
	inFlight prometheus.Gauge
}

func NewMetrics(pool *pgxpool.Pool) *Metrics {
	m := &Metrics{
		Registry: prometheus.NewRegistry(),
		// RED method: Rate, Errors, Duration. These three answer "is the
		// service healthy?" for any request-driven system.
		requests: prometheus.NewCounterVec(prometheus.CounterOpts{
			Name: "http_requests_total",
			Help: "Completed HTTP requests.",
		}, []string{"method", "route", "status"}),
		duration: prometheus.NewHistogramVec(prometheus.HistogramOpts{
			Name:    "http_request_duration_seconds",
			Help:    "HTTP request latency.",
			Buckets: []float64{.005, .01, .025, .05, .1, .25, .5, 1, 2.5, 5, 10},
		}, []string{"method", "route"}),
		inFlight: prometheus.NewGauge(prometheus.GaugeOpts{
			Name: "http_requests_in_flight",
			Help: "Requests currently being served.",
		}),
	}
	m.Registry.MustRegister(
		m.requests, m.duration, m.inFlight,
		collectors.NewGoCollector(),                                       // goroutines, GC, heap
		collectors.NewProcessCollector(collectors.ProcessCollectorOpts{}), // fds, cpu, rss
	)
	if pool != nil {
		m.Registry.MustRegister(newPoolCollector(pool))
	}
	return m
}

// Handler serves the registry in Prometheus text format.
func (m *Metrics) Handler() http.Handler {
	return promhttp.HandlerFor(m.Registry, promhttp.HandlerOpts{})
}

// Middleware records RED metrics. The `route` label is the registered PATTERN
// ("GET /users/{id}"), never the raw path ("/users/42"): raw paths would mint a
// new time series per id (a "cardinality explosion") and could crash Prometheus.
//
// IMPORTANT ordering rule: r.Pattern is filled in by the ServeMux on the exact
// *http.Request it receives. This middleware must therefore sit where it hands
// that same request to the mux unchanged: after any middleware that copies the
// request (r.WithContext). See cmd/rest/main.go for the chain.
func (m *Metrics) Middleware(next http.Handler) http.Handler {
	return http.HandlerFunc(func(w http.ResponseWriter, r *http.Request) {
		m.inFlight.Inc()
		defer m.inFlight.Dec()

		start := time.Now()
		rec := NewStatusRecorder(w)
		next.ServeHTTP(rec, r)

		route := r.Pattern
		if route == "" {
			route = "unmatched" // 404s for unknown paths share one label
		}
		m.requests.WithLabelValues(r.Method, route, strconv.Itoa(rec.Status)).Inc()
		m.duration.WithLabelValues(r.Method, route).Observe(time.Since(start).Seconds())
	})
}

// StatusRecorder remembers the status code, which http.ResponseWriter does not
// let us read back after the fact.
type StatusRecorder struct {
	http.ResponseWriter
	Status int
}

func NewStatusRecorder(w http.ResponseWriter) *StatusRecorder {
	return &StatusRecorder{ResponseWriter: w, Status: http.StatusOK}
}

func (s *StatusRecorder) WriteHeader(code int) {
	s.Status = code
	s.ResponseWriter.WriteHeader(code)
}

// Unwrap lets http.ResponseController reach Flush/Hijack on the real writer.
func (s *StatusRecorder) Unwrap() http.ResponseWriter { return s.ResponseWriter }

// poolCollector exposes pgxpool.Stat() as Prometheus metrics. A custom
// Collector reads the stats at scrape time, so values are always current and
// there is no background goroutine.
type poolCollector struct {
	pool                                          *pgxpool.Pool
	acquired, idle, total, max, acquires, emptyAc *prometheus.Desc
	waitSeconds                                   *prometheus.Desc
}

func newPoolCollector(pool *pgxpool.Pool) *poolCollector {
	d := func(name, help string) *prometheus.Desc {
		return prometheus.NewDesc("db_pool_"+name, help, nil, nil)
	}
	return &poolCollector{
		pool:        pool,
		acquired:    d("acquired_conns", "Connections currently in use."),
		idle:        d("idle_conns", "Idle connections."),
		total:       d("total_conns", "Open connections."),
		max:         d("max_conns", "Configured pool maximum."),
		acquires:    d("acquire_total", "Total successful connection acquisitions."),
		emptyAc:     d("empty_acquire_total", "Acquisitions that had to WAIT because the pool was exhausted."),
		waitSeconds: d("acquire_wait_seconds_total", "Total time spent waiting for a connection."),
	}
}

func (c *poolCollector) Describe(ch chan<- *prometheus.Desc) {
	for _, d := range []*prometheus.Desc{c.acquired, c.idle, c.total, c.max, c.acquires, c.emptyAc, c.waitSeconds} {
		ch <- d
	}
}

func (c *poolCollector) Collect(ch chan<- prometheus.Metric) {
	s := c.pool.Stat()
	g, ctr := prometheus.GaugeValue, prometheus.CounterValue
	ch <- prometheus.MustNewConstMetric(c.acquired, g, float64(s.AcquiredConns()))
	ch <- prometheus.MustNewConstMetric(c.idle, g, float64(s.IdleConns()))
	ch <- prometheus.MustNewConstMetric(c.total, g, float64(s.TotalConns()))
	ch <- prometheus.MustNewConstMetric(c.max, g, float64(s.MaxConns()))
	ch <- prometheus.MustNewConstMetric(c.acquires, ctr, float64(s.AcquireCount()))
	ch <- prometheus.MustNewConstMetric(c.emptyAc, ctr, float64(s.EmptyAcquireCount()))
	ch <- prometheus.MustNewConstMetric(c.waitSeconds, ctr, s.AcquireDuration().Seconds())
}
Create internal/observability/tracing.go
package observability

import (
	"context"
	"fmt"

	"go.opentelemetry.io/otel"
	"go.opentelemetry.io/otel/attribute"
	"go.opentelemetry.io/otel/exporters/otlp/otlptrace/otlptracegrpc"
	"go.opentelemetry.io/otel/propagation"
	"go.opentelemetry.io/otel/sdk/resource"
	sdktrace "go.opentelemetry.io/otel/sdk/trace"
)

// InitTracing installs a global OpenTelemetry tracer provider that exports
// spans over OTLP/gRPC (to Jaeger, Tempo, an OTel Collector, ...). With an
// empty endpoint tracing stays a no-op: spans are free and nothing is sent.
// The returned function flushes buffered spans; call it on shutdown.
func InitTracing(ctx context.Context, service, endpoint string, sampleRatio float64) (func(context.Context) error, error) {
	// Propagation is what stitches traces ACROSS services: it reads/writes the
	// W3C `traceparent` header so a caller's trace continues in this service.
	otel.SetTextMapPropagator(propagation.NewCompositeTextMapPropagator(
		propagation.TraceContext{}, propagation.Baggage{}))

	if endpoint == "" {
		return func(context.Context) error { return nil }, nil
	}

	exp, err := otlptracegrpc.New(ctx,
		otlptracegrpc.WithEndpoint(endpoint),
		otlptracegrpc.WithInsecure()) // plaintext inside the private network
	if err != nil {
		return nil, fmt.Errorf("create otlp exporter: %w", err)
	}

	res, err := resource.New(ctx, resource.WithAttributes(attribute.String("service.name", service)))
	if err != nil {
		return nil, fmt.Errorf("create resource: %w", err)
	}

	tp := sdktrace.NewTracerProvider(
		sdktrace.WithBatcher(exp), // buffer + send in batches, off the request path
		sdktrace.WithResource(res),
		// ParentBased: if an upstream service already decided to sample this
		// trace, follow it; otherwise sample sampleRatio of new traces.
		sdktrace.WithSampler(sdktrace.ParentBased(sdktrace.TraceIDRatioBased(sampleRatio))),
	)
	otel.SetTracerProvider(tp)
	return tp.Shutdown, nil
}
Change internal/storage/storage.go
--- a/internal/storage/storage.go
+++ b/internal/storage/storage.go
@@ -8,6 +8,7 @@ import (
 	"io/fs"
 	"time"

+	"github.com/exaring/otelpgx"
 	"github.com/jackc/pgx/v5/pgxpool"
 	"github.com/jackc/pgx/v5/stdlib"
 	"github.com/pressly/goose/v3"
@@ -51,6 +52,10 @@ func NewPool(ctx context.Context, c PoolConfig, opts ...func(*pgxpool.Config)) (
 	cfg.MaxConnIdleTime = c.MaxConnIdleTime
 	cfg.HealthCheckPeriod = 30 * time.Second

+	// otelpgx emits a trace span for every query, nested under the HTTP
+	// request's span because we always pass the request context.
+	cfg.ConnConfig.Tracer = otelpgx.NewTracer(otelpgx.WithTrimSQLInSpanName())
+
 	for _, o := range opts {
 		o(cfg)
 	}
Replace the contents of cmd/rest/main.go with
package main

import (
	"context"
	"errors"
	"fmt"
	"log/slog"
	"net"
	"net/http"
	"os"
	"os/signal"
	"syscall"
	"time"

	"go.opentelemetry.io/contrib/instrumentation/net/http/otelhttp"

	"go-rest/internal/config"
	"go-rest/internal/handlers"
	"go-rest/internal/middleware"
	"go-rest/internal/observability"
	"go-rest/internal/routes"
	"go-rest/internal/storage"
)

// One binary, three modes:
//
//	server            run the API (default)
//	server migrate    apply DB migrations, then exit
//	server healthcheck  probe the local admin port, exit 0/1 (for Docker HEALTHCHECK;
//	                    the distroless image has no curl/wget)
func main() {
	cmd := "serve"
	if len(os.Args) > 1 {
		cmd = os.Args[1]
	}

	var err error
	switch cmd {
	case "serve":
		err = serve()
	case "migrate":
		err = migrate()
	case "healthcheck":
		err = healthcheck()
	default:
		err = fmt.Errorf("unknown command %q (want serve|migrate|healthcheck)", cmd)
	}
	// run-style functions return errors instead of calling log.Fatal: Fatal
	// calls os.Exit, which skips deferred cleanup (closing the pool, etc.).
	if err != nil {
		slog.Error("fatal", "err", err)
		os.Exit(1)
	}
}

func migrate() error {
	cfg, err := config.Load()
	if err != nil {
		return err
	}
	log := observability.NewLogger(os.Stdout, cfg.LogLevel, cfg.ServiceName)
	ctx, stop := signal.NotifyContext(context.Background(), os.Interrupt, syscall.SIGTERM)
	defer stop()

	pool, err := storage.NewPool(ctx, poolConfig(cfg))
	if err != nil {
		return err
	}
	defer pool.Close()

	if err := storage.Migrate(ctx, pool); err != nil {
		return err
	}
	log.Info("migrations applied")
	return nil
}

func healthcheck() error {
	addr := os.Getenv("ADMIN_ADDR")
	if addr == "" {
		addr = ":9090"
	}
	_, port, err := net.SplitHostPort(addr)
	if err != nil {
		return err
	}
	client := http.Client{Timeout: 3 * time.Second}
	resp, err := client.Get("http://127.0.0.1:" + port + "/readyz")
	if err != nil {
		return err
	}
	defer resp.Body.Close()
	if resp.StatusCode != http.StatusOK {
		return fmt.Errorf("not ready: %s", resp.Status)
	}
	return nil
}

func poolConfig(cfg config.Config) storage.PoolConfig {
	return storage.PoolConfig{
		URL:             cfg.DatabaseURL,
		MaxConns:        cfg.DBMaxConns,
		MinConns:        cfg.DBMinConns,
		MaxConnLifetime: cfg.DBMaxConnLife,
		MaxConnIdleTime: cfg.DBMaxConnIdle,
	}
}

func serve() error {
	cfg, err := config.Load()
	if err != nil {
		return err
	}
	log := observability.NewLogger(os.Stdout, cfg.LogLevel, cfg.ServiceName)
	slog.SetDefault(log)

	// ctx is cancelled on Ctrl-C (SIGINT) or SIGTERM (what Docker/Kubernetes
	// send on stop), which triggers graceful shutdown below.
	ctx, stop := signal.NotifyContext(context.Background(), os.Interrupt, syscall.SIGTERM)
	defer stop()

	shutdownTracing, err := observability.InitTracing(ctx, cfg.ServiceName, cfg.OTLPEndpoint, cfg.TraceSampleRatio)
	if err != nil {
		return err
	}

	pool, err := storage.NewPool(ctx, poolConfig(cfg))
	if err != nil {
		return err
	}
	defer pool.Close() // runs last (defers are LIFO), after the servers stop

	metrics := observability.NewMetrics(pool)
	health := observability.NewHealth(pool)

	limits := handlers.Limits{MaxBodyBytes: cfg.MaxBodyBytes, MaxNameLen: cfg.MaxNameLen}
	users := handlers.NewUserHandler(storage.NewUserStore(pool), log, limits)
	orders := handlers.NewOrderHandler(storage.NewOrderStore(pool), log, limits)
	mux := http.NewServeMux()
	routes.SetupRoutes(mux, users, orders)

	// First listed = outermost. ORDER MATTERS:
	//  1. otelhttp, RequestID, Timeout all COPY the request (r.WithContext), so
	//     they go first.
	//  2. Logging and Metrics read r.Pattern after the mux has routed. The mux
	//     sets it on the exact request object it receives, so these must pass
	//     the request through unchanged: they come after every copier.
	//  3. Recover is innermost so a panic becomes a 500 that Logging/Metrics
	//     still record.
	api := &http.Server{
		Addr: cfg.Addr,
		Handler: middleware.Chain(mux,
			func(next http.Handler) http.Handler { return otelhttp.NewHandler(next, "http.server") },
			middleware.RequestID,
			middleware.Timeout(cfg.RequestTimeout),
			middleware.TraceRoute,
			middleware.Logging(log),
			metrics.Middleware,
			middleware.Recover(log),
		),
		// The zero-value http.Server has NO timeouts, so slow or malicious
		// clients (e.g. Slowloris) can hold connections open forever.
		ReadHeaderTimeout: cfg.ReadHeaderTimeout,
		ReadTimeout:       cfg.ReadTimeout,
		WriteTimeout:      cfg.WriteTimeout,
		IdleTimeout:       cfg.IdleTimeout,
	}

	// Operational endpoints live on a SEPARATE port: metrics and health are for
	// Prometheus/orchestrators, and must never be exposed through the public
	// listener / ingress.
	adminMux := http.NewServeMux()
	adminMux.Handle("GET /metrics", metrics.Handler())
	adminMux.HandleFunc("GET /healthz", health.Live)
	adminMux.HandleFunc("GET /readyz", health.Ready)
	admin := &http.Server{Addr: cfg.AdminAddr, Handler: adminMux, ReadHeaderTimeout: 5 * time.Second}

	errc := make(chan error, 2)
	for name, srv := range map[string]*http.Server{"api": api, "admin": admin} {
		go func() {
			log.Info("listening", "server", name, "addr", srv.Addr)
			errc <- srv.ListenAndServe()
		}()
	}

	select {
	case err := <-errc:
		// ErrServerClosed is the normal result of Shutdown, not a failure.
		if !errors.Is(err, http.ErrServerClosed) {
			return err
		}
	case <-ctx.Done():
		log.Info("shutdown signal received")
	}

	// Graceful shutdown sequence:
	//  1. fail /readyz so the load balancer stops routing new traffic here,
	//  2. optionally wait ShutdownDelay so it notices,
	//  3. stop accepting connections and let in-flight requests finish,
	//  4. flush buffered traces, then (deferred) close the DB pool.
	health.SetShuttingDown()
	time.Sleep(cfg.ShutdownDelay)

	sctx, cancel := context.WithTimeout(context.Background(), cfg.ShutdownTimeout)
	defer cancel()
	var errs []error
	errs = append(errs, api.Shutdown(sctx), admin.Shutdown(sctx), shutdownTracing(sctx))
	if err := errors.Join(errs...); err != nil {
		return err
	}
	log.Info("server stopped cleanly")
	return nil
}
Replace the contents of makefile with
.PHONY: run build test db migrate clean

BINARY := bin/server

# Where the app and the tests find PostgreSQL. `make db` starts a matching one.
export DATABASE_URL ?= postgres://app:change-me@localhost:5432/app?sslmode=disable
TEST_DATABASE_URL ?= $(DATABASE_URL)

run:                      ## run the API (needs a database: make db)
	go run ./cmd/rest

build:
	mkdir -p bin
	CGO_ENABLED=0 go build -trimpath -ldflags="-s -w" -o $(BINARY) ./cmd/rest

test:                     ## vet + all tests (database tests run against $(TEST_DATABASE_URL))
	go vet ./...
	TEST_DATABASE_URL="$(TEST_DATABASE_URL)" go test -race ./...

migrate:                  ## apply database migrations, then exit
	go run ./cmd/rest migrate

db:                       ## start a throwaway PostgreSQL in Docker (its data disappears with the container)
	docker run -d --name pg -p 5432:5432 \
		-e POSTGRES_USER=app -e POSTGRES_PASSWORD=change-me -e POSTGRES_DB=app \
		postgres:17-alpine

clean:
	rm -rf bin
Try it
Migrations are now a separate command (more on why in Part 8):
export DATABASE_URL='postgres://app:change-me@localhost:5432/app?sslmode=disable'
go run ./cmd/rest migrate        # applies schema, then exits
go run ./cmd/rest                # serves :7800, admin :9090
$ curl -i -H 'X-Request-ID: demo-123' localhost:7800/users/1
HTTP/1.1 200 OK
X-Request-Id: demo-123

$ curl localhost:9090/healthz
ok
$ curl localhost:9090/readyz
ready
$ curl -s localhost:9090/metrics | grep http_requests_total
Stop Postgres (docker stop pg) and call /readyz again: it returns 503 database unavailable, while /healthz still says ok. Start it again and readiness recovers on its own.
Recap
- Three pillars: metrics tell you that, traces tell you where, logs tell you what.
- Put a correlation id (request id, trace id) on every signal.
- RED metrics + histograms; label with route patterns, never raw paths.
- Export pool statistics; pool exhaustion is invisible without them.
- Liveness ≠ readiness; never check dependencies in liveness.
- Operational endpoints on a separate, private port.
- Middleware order matters.
Exercises
- Add a counter
users_created_total. Where is the right place to increment it: handler or store? Why? - Make the logger include
user_agent. Is it safe to add any header to logs? Think about what an attacker controls. - Add a histogram for DB query time using a
pgxtracer. What labels would be safe?
Comments
Join the discussionNo comments yet. Be the first to comment.
Build a production-grade REST API in Go
A hands-on series: start with under 200 lines of in-memory CRUD and end with Postgres, JWT auth, rate limiting, TLS and a full observability stack.